Narendra Modi government’s second year report card
7 charts that show how the NDA has performed in its second year in power
 Premium
The Modi government gets at best a C for its second year in office from surveys of businesses and the economy.
Its report card would probably go like this: we have always had high hopes from this government, but it has not lived up to its potential. Instead of wasting time and energy in extra-curricular distractions, it should apply itself more diligently to growing the economy.
Here are the numbers:

Chart 1: The chart, taken from the Reserve Bank of India’s surveys of professional forecasters, sums up the disappointment about the economic growth. It shows how forecasts of real GVA (gross value added) growth at basic prices have slowly been revised down. The most recent survey in April 2016 indicates that forecasters, although optimistic, are unwilling to stick their necks out and project above 8% growth in the near future—a prediction they were all too willing to make earlier. Once bitten, twice shy.

Chart 2: This chart shows the steady erosion in business sentiment in the last two years.
The MNI Business Expectations Index, from the Deutsche Börse Group, which is a gauge of business sentiment among firms in industry, services, construction and agriculture sectors, is now way below where it was when the Modi government took over the reins of power.
The euphoria about rosy business prospects lasted a while, peaking in September 2014 before slowly dissipating. In April 2016, this index reached its lowest point since the new government took charge. Businessmen seem to have finally realized that Modi is no wizard, but a mere Muggle like the rest of us.

Chart 3: Business expectations may have declined sharply, but has the government been able to shore up consumer confidence? The chart, from the RBI consumer confidence survey, shows that consumer sentiment was slow to move up after the new government took office, but it reached a peak in the March 2015 quarter, as oil prices fell and inflation declined.
That optimism faded rather quickly, as the extent of rural distress became clearer.
But consumer confidence has recently seen an uptick in the March 2016 quarter, although it’s still well below where the index was a year ago. A good monsoon this year and higher pay for government employees should brighten the mood considerably.
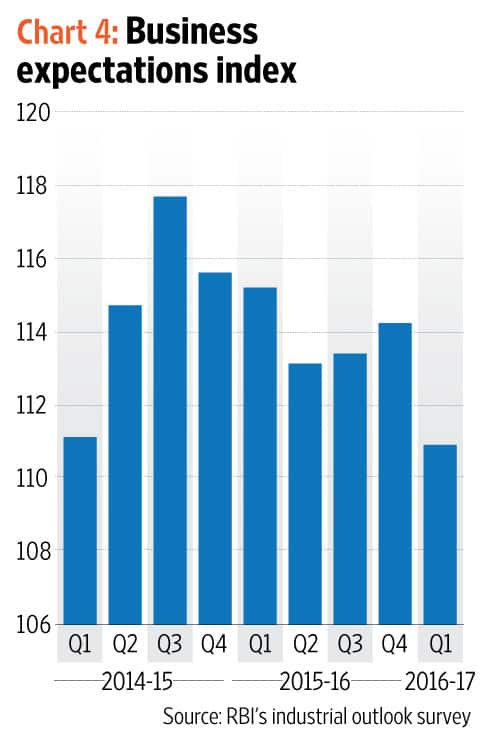
Chart 4: This is the Business Expectations Index from the RBI Industrial Outlook survey.
The chart shows that business expectations in industry for the first quarter of 2016-17 are at their lowest in the last two years. “Animal spirits" in the industrial sector are drooping.

Chart 5: This chart, from the RBI obicus (order books, inventories & capacity utilization survey) shows capacity utilization among manufacturing firms.
Since capacity utilization is affected by seasonal factors, we should compare a quarter with the same quarter a year ago. By that yardstick, capacity utilization in the December 2015 quarter was higher than in December 2014 quarter but lower than for the December 2013 quarter.
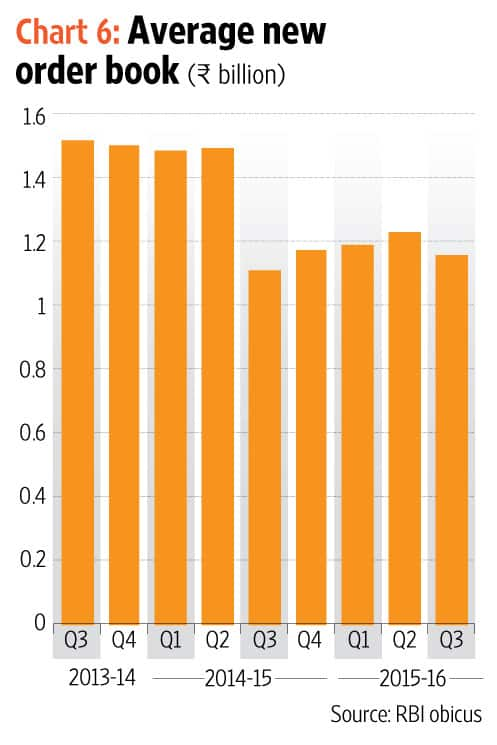
Chart 6: The inflow of new orders is illustrated by this chart, culled from the RBI obicus survey. With capacity utilization so low and several projects stalled, new orders have fallen sharply from the levels they were at in 2013-14. That is a gloomy indication that investment demand is unlikely to come back in a hurry.

Chart 7: This chart tracks the performance of the Nikkei India Composite Index, a snapshot of seasonally adjusted month-on-month growth in the private sector.
The chart shows momentum picked up in 2014 and reached a peak in early 2015 before slipping and even dipping into negative territory briefly last June. (A reading above 50 denotes expansion from the previous month, while one below 50 indicates contraction).
A revival of activity in 2016, particularly in March, has been the silver lining, but the pace of expansion faltered again in April. There have been several instances earlier when the composite index has flattered to deceive, and it’s too early to say whether the improvement will be sustained, though the most recent corporate data is encouraging.
Overall remarks: Plenty of room for improvement. Has the capability to do much better.
Manas Chakravarty looks at trends and issues in the financial markets. Comments are welcome at capitalaccount@livemint.com
Unlock a world of Benefits! From insightful newsletters to real-time stock tracking, breaking news and a personalized newsfeed – it's all here, just a click away! Login Now!


