India’s ten per cent capitalism, in six charts
The Indian economy has one of the highest growth rates in the world, but that growth hides disturbing long-term trends
 has steadily declined and that of services sector increased, but employment data is still skewed.") Premium
Premium
The Indian economy has one of the highest growth rates in the world, but that growth hides disturbing long-term trends. Here are some of them that, illustrated by charts, exposing deep structural flaws in the kind of growth we have:
Chart 1 shows that while gross domestic product (GDP) growth in every decade since the 1970s has been higher than in the previous one, agricultural growth, on the other hand, has been steadily decelerating since the eighties.

The compounded annual rate of growth of agriculture, at constant prices, in the 1980s was 4.24%. It fell to 3.17% in the 1990s and to 2.37% in the first decade of this century. While the rest of the economy was revving up, thanks to economic liberalization, agricultural growth was winding down, as the push given by the Green Revolution lost momentum.
The chart also shows that agricultural growth hasn’t been anything to boast about in the past five years. In fact, the contribution of agriculture to gross value added at basic prices in the past five years, at constant prices, has been a mere 6.3%.
The diminishing importance of agriculture as a source of growth has led to its neglect. Chart 2 shows that the share of institutional sources of credit in total loans has been coming down since 1991 in rural areas. For farmers, the share of loans from institutions has fallen from 63% in 1981 to 58% by 2012, leaving them to the tender mercies of moneylenders.

As this column had shown earlier, it is the poorer farmers who borrow the most from moneylenders. Is this the financial inclusion we brag about?
Why is low growth in agriculture a big deal? It’s important because agriculture is still by far the biggest source of employment in this country. Construction, trade and “other services" are other major sources of jobs for the masses.
Chart 3, from the Reserve Bank of India’s (RBI’s) KLEMS database, shows the compounded annual growth in total employment has been decelerating. It was 2% in the decade between 1980-81 and 1990-91; 1.63% in the next decade and 1.35% between 2000-01 and 2011-12.

During this last period, people left farm employment to take up jobs mainly in construction, which contributed more than half of the net addition to jobs. The recent slowdown in the sector, therefore, means that a prime source of jobs for the masses has dried up.
Labour productivity in agriculture, according to the KLEMS database, has just about doubled since 1980, not good progress at all (chart 4).
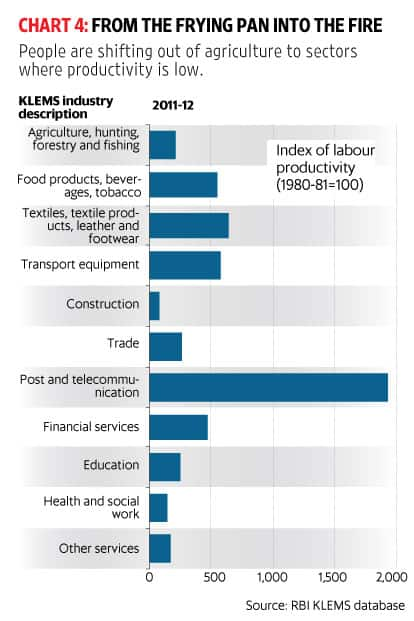
Contrast labour productivity in textiles and leather products, which has gone up about six-and-a-half times since 1980. This is the reason why it is necessary to move labour out of agriculture to the far more productive industry or services sectors. But, as the chart shows, construction, too, has low labour productivity—its index of labour productivity is lower than in 1980-81. People moving out of farming are shifting to low productivity jobs, which don’t pay well.
One big reason why productivity is so low in India is because the size of the average business is so small. Chart 5 shows that the average non-agricultural business in 2013 employed a mere 2.39 workers. Worse, the data shows that this average is now lower than in 1980.

More than 95% of businesses employ between one and five workers. They do not have the resources to scale up or improve productivity and merely enable their workers to survive.
The impact of these trends is best illustrated by chart 6, which shows the glaring inequalities in wealth in the country. The share of the richest 1% has gone up from 40.3% in 2010 to 58.4% by 2016.

During the high noon of socialism in this country, Pakistani economist Mahbub-ul-Haq once said India had “ten per cent socialism", meaning that 10% of workers had secure and safe jobs, regular wages and leave, provident fund, gratuity and medical benefits. The rest worked in nasty, brutish jobs—without any security—that paid a pittance.
We have now adopted capitalism, but little else has changed. We have an elite ten per cent, working in highly productive, globally competitive, modern sectors; below it are a few who do relatively well by clinging on to the coat-tails of the rich and powerful; and then we have the “huddled masses yearning to breathe free". We now have ten per cent capitalism.
Manas Chakravarty looks at trends and issues in the financial markets. Respond to this column at manas.c@livemint.com.
Unlock a world of Benefits! From insightful newsletters to real-time stock tracking, breaking news and a personalized newsfeed – it's all here, just a click away! Login Now!


